top of page
Infographics
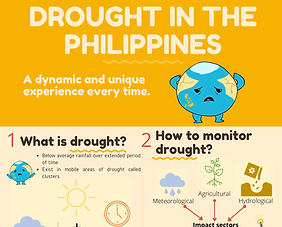
These infographics summarize key findings from research on the following: tropical cyclone, sea surface temperature, thunderstorms and drought.
Tropical Cyclone

Click here to view the full inforgaphic
(file size 6.1MB)
Sea Surface Temperature

Click here to view the full inforgaphic
(file size 2.1MB)

bottom of page